
By Georgi Georgiev
From buying everything in 2021 to selling everything through the past year. This is precisely how we can describe what happened in terms of the two main types of assets – stocks and bonds.
The year turned out to be one of the most devastating in terms of “lost fortune” for both. That made it the worst performance of the typical 60:40 stock/bond balanced portfolio in 100 years, casting serious doubt on the hope that another strong period of Buy&Hold investing is behind us. At one point, one such portfolio's losses exceeded 24% before markets began to interpret a possible change in the Fed's next steps (the so-called Pivot). It was central bank policy that led to this highly negative development for the capital markets in 2022. But let's go back in time a bit to trace exactly what happened.
Before we make an adequate prognosis for the most possible scenarios about markets’ performance from now on, it is appropriate to note that practically after the Great Financial Crisis the capital markets found themselves in another bull cycle where the Buy&Hold strategy worked extremely well. Those who bought stocks and bonds at the beginning of the last decade enjoyed a serious appreciation of their assets, thanks also to the stimulus policies of central banks, which increasingly became the main factor that investors reckoned with. Near-zero interest rates and ever-expanding central bank balance sheets aimed at stimulating the economy have led to strong growth in markets. Investors constantly poured money into them in search of better returns.
At one point TINA (There is no alternative) became the leading dogma in investing. It also coincided with an extremely positive environment towards ever-wider globalization, strong technology growth, a relatively weak dollar and largely normal geopolitical relations, compared to what happened in 2022. The tailwind has largely resulted in the state falling into an almost "permanent bull market" and in anticipation of central banks supporting the economy at any cost. The absence of the "great evil" in the face of this decade's barely-creeping inflation, which central banks did not have to contend with, and on the contrary – they failed for long periods to reach averages levels – was also not part of the equation.
The history has proven that markets often have a tendency to overreact in either direction and can remain irrational for long periods.
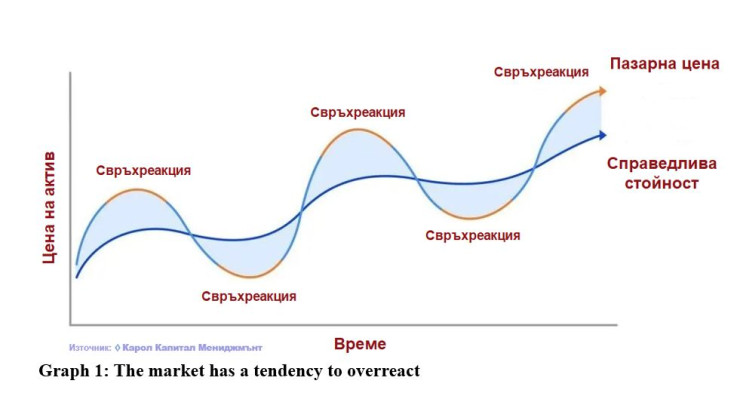
Graph 1: The market has a tendency to overreact
All of that has practically changed dramatically this year, although the cracks were obvious and getting wider over the years and it was only a matter of time before they materialized as a risk to the global economy and markets in general. Since the emergence of covid-19, extraordinary additional fiscal stimulus has led to another injection of capital, which has further increased the risk appetite of investors. This was reflected in the boom in crypto-assets and in the record listings of new companies (over 60% in the form of SPACs – specially created instruments with raised cash, buying any companies). We witnessed the serious "ballooning" of a number of assets that began to trade at unsustainably high levels, reflecting overly optimistic scenarios.
At one point, disrupted supply chains, along with pandemic shutdowns, topped with high cash levels and not least the serious drive to make the green transition, led to serious mismatches between supply and demand for basic products and commodities. This was enough to release the forgotten "inflation genie" from the bottle.
Gradually, the price levels rose, and the big central banks missed the moment to react preemptively, which should be their role. The Fed even long termed inflation as temporary. Things took a turn for the worse early this year when the error was reported and a period of rapid rate hikes (one of the fastest hikes on record) began, from zero levels in March to 4.25%-4.5% at the end of the year.
All this happened with the announced gradual withdrawal of liquidity by the central banks, which is the main fuel for the growth of the markets. Thus, the sobering was swift and the major asset classes suffered serious sell-offs. Interest rate hikes pushed up bond yields and negatively impacted company valuations. Inflation was under steam and by the end of the summer it did not stop its rise, which led to ever higher expectations for an additional rise in interest rates.
The Fed was definitely several steps ahead of the ECB in this regard, leading to a serious appreciation of the dollar. Gradually, the Fed's rhetoric began to show a firm determination to quell inflation, even at the cost of plunging the economy into recession. Markets have also begun to discount the likelihood of her appearing. Corporate earnings expectations gradually began to be revised downwards, and investors' focus turned to whether the Fed would report that it had managed to deal with inflation and was ready to make that very pivot to return interest rates to "normal" levels, or at least stop their rise until the middle of next year.
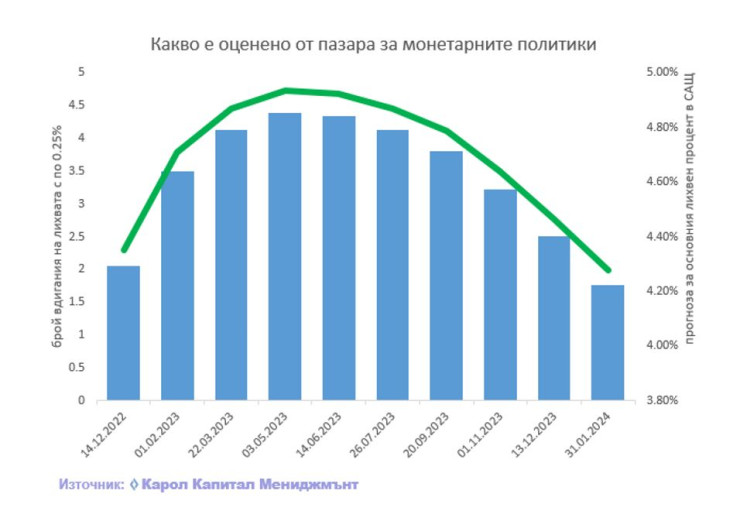
Graph. 2 US prime rate forecast
What can we expect in the coming year?
The main question is what comes next. We at Carroll Capital Management have several scenarios for the development in 2023. In the most likely one, we expect to go through a recession that is not so deep. It is reasonable to see a decline in corporate profits, which typically fall by at least 10% during a recession.
Statistics show that typically during a bear market, stocks fall an average of 34% over a 14-month period. So far, historically, a bear market has never ended before the economy went into recession. Also, never before has the market formed a bottom before the Fed made a Pivot in its policy. Moreover, once such action was recorded, it initially led to further negative market reaction before the bottom was recorded. We all know the maxim that history never repeats itself perfectly, but it "often rhymes."
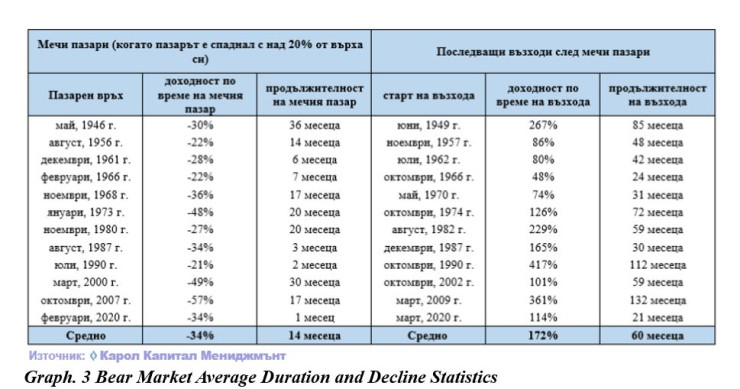
Graph. 3 Bear Market Average Duration and Decline Statistics
With a high probability, we believe that with the steps taken (albeit belatedly) the Fed will be able to "tame" inflation. But to make it sustainable, the interest rate needs to remain at high enough levels for a long enough time (probably at levels of 4.5%-5%). It is very important not to make the fatal mistake of the mid-1970s, when the Fed rushed to cut interest rates after declaring that it had dealt with inflation. This leads to even higher inflation afterwards and, respectively, to higher interest rates.
The expectation is that in early 2023 we will see a rapid development similar to that of the turn of the century between 2000-2002, when technology stocks and growth companies took the hit first, while representatives of the old economy (energy and cyclical stocks) followed only at the end of 2001.
This is exactly the kind of divergence we are currently observing, which also explains the stable performance of the broad S&P 500 index, which has lost just over 25% from its peak (in mid-October). In our baseline scenario, we expect at least one test at this level. With a more assertive Fed, even with the risk of a more severe recession, declines to average levels in a bear market are entirely possible.
However, we must also take into account the serious differences compared to the last major crisis (the one in 2008).
The first is that households are in much better shape – with much lower debt and much more savings than they were then. The "stimulus in the form of checks" and low interest rates in recent years have also helped significantly.
Not only consumers overseas, but the corporate balance sheets of companies there look far better positioned for the looming recession than they did before the GFC (Great Financial Crisis). A large number of companies have made the most of the last few years and managed to raise long-term debt at low interest rates, and now the weighted average debt of companies in the S&P500 is four years longer to maturity than in 2007, for example.
Another serious factor is that a large number of the professional investors are extremely defensively positioned (the lowest weighting on stocks) and hold one of their highest levels of cash in their portfolios for the last 20 years. This is without a doubt a strong contra-indicator.
Last, but not least, we always have to consider what the politicians' response would be. There is no way in a deep crisis to get away with a new dose of more active fiscal policy. This will naturally have a pro-inflationary effect, in addition to distortions along the transition to a greener economy, deglobalization processes and relocations of production.
Over the next year and after that, the key, according to us, will be to rotate assets and individual sectors in the portfolio. We are definitely entering a more challenging environment that is without precedent. We believe that there will be periods of ups and downs in which active management will significantly beat a passive buy&hold strategy.
However, what is certain, is that the market will once again be the right barometer and react with preemptively – usually six months before the bottom of the real economy is found. Also, we must not forget that the corrections will give very good opportunities to buy undeservedly undervalued assets at attractive levels.
THE BOTTOM LINE The expectation is that in early 2023 we will see a rapid development similar to that of the beginning of the century between 2000-2002